Summary
Increase Loan Discount to 20% from 11% in the CRV-long LlamaLend market on mainnet.
Anaysis
Bad Debt Snapshot
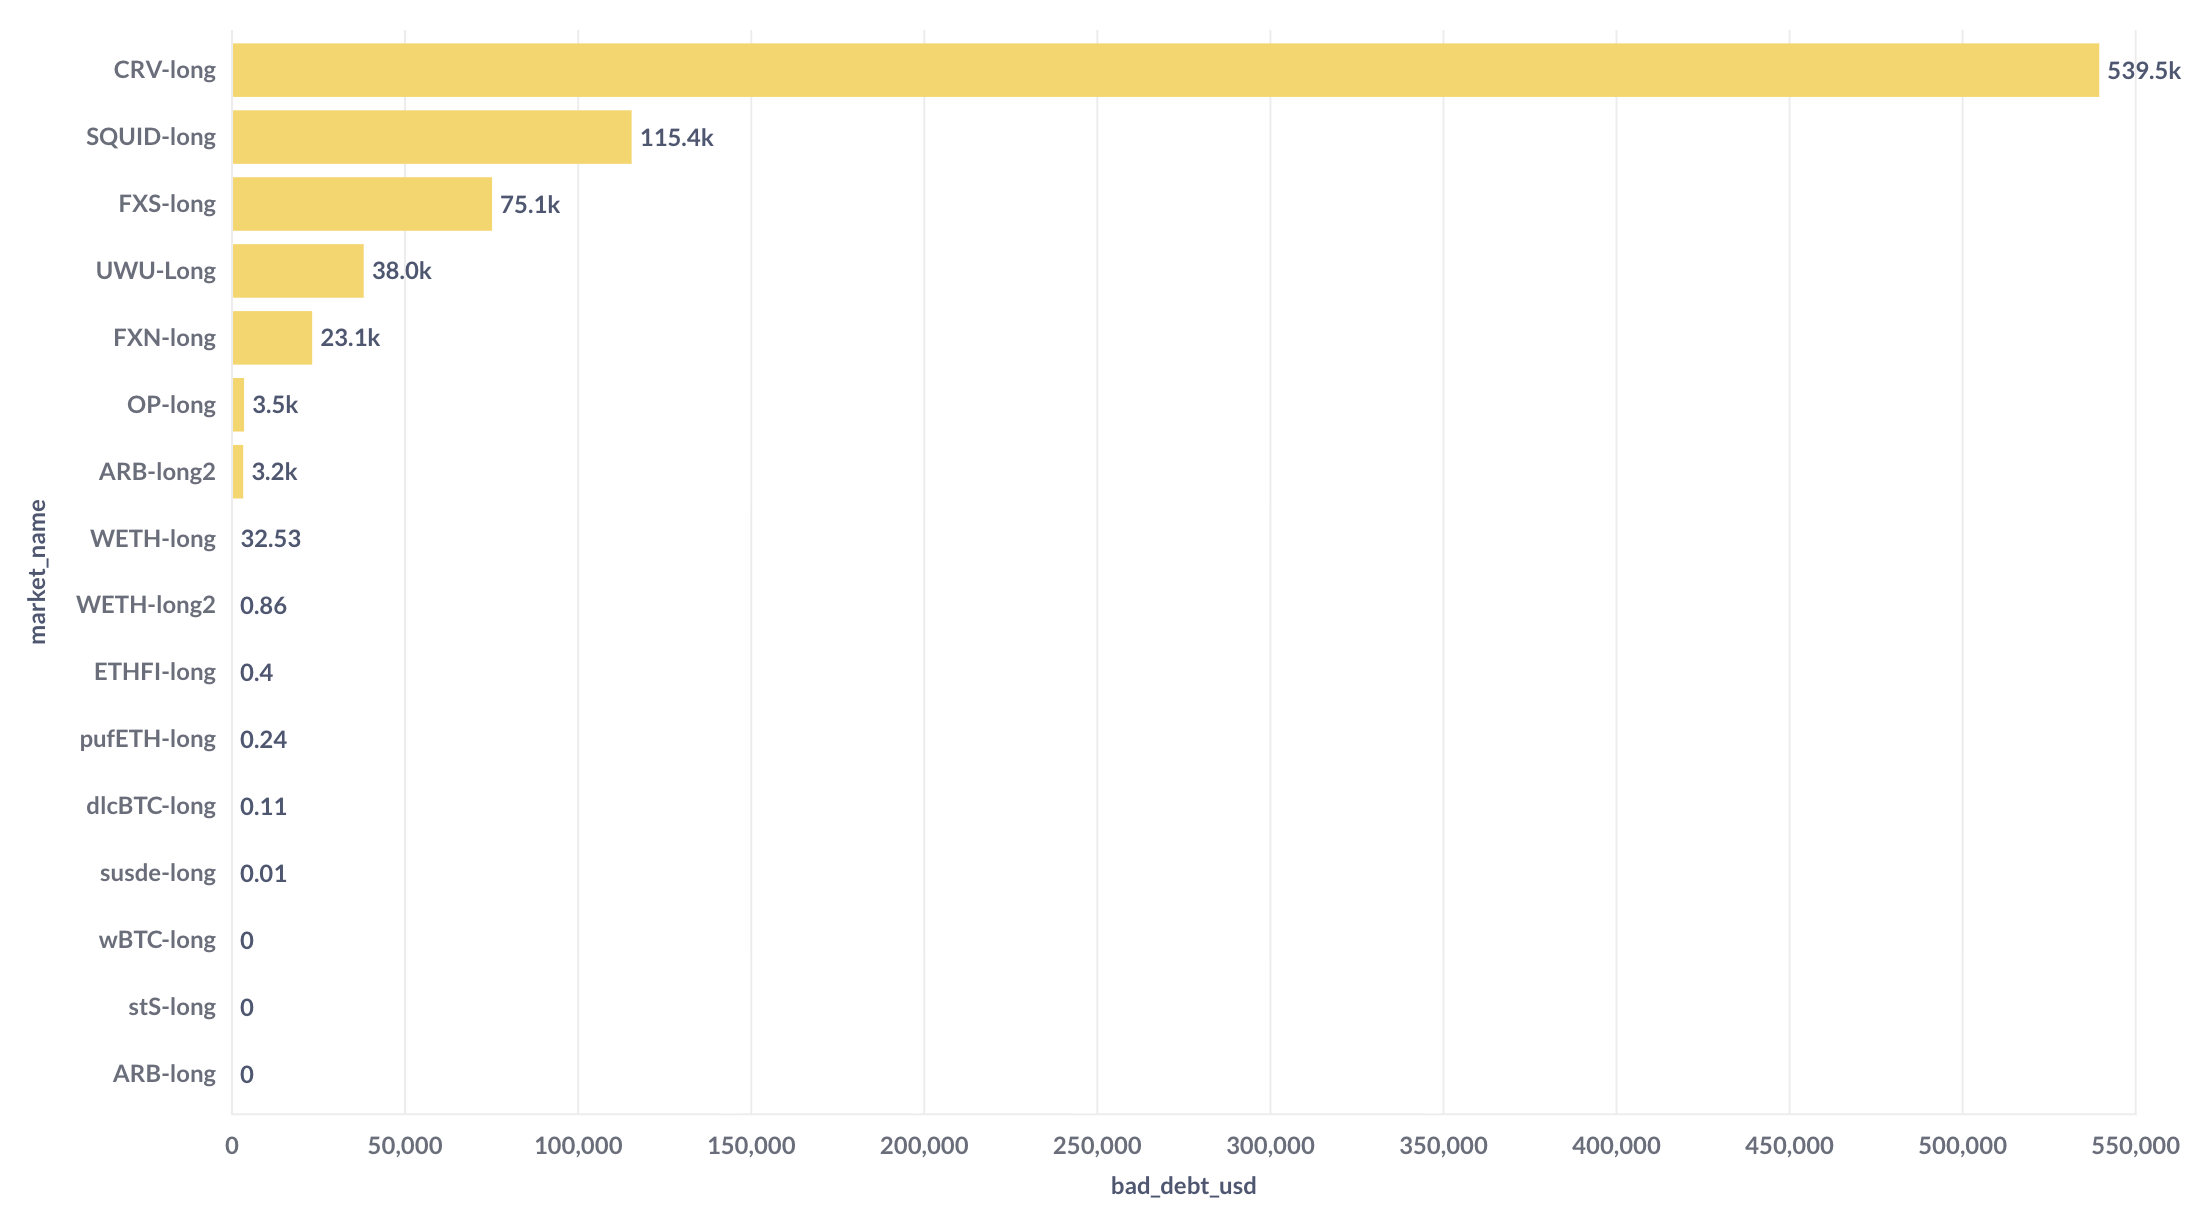
We see that 7 LlamaLend markets currently hold bad debt greater than $100:
- CRV-long
- SQUID-long
- FXS-long
- UwU-long
- FXN-long
- OP-long
- ARB-long2
7 Day Bad Debt Progression 06-10-2025 to 13-10-2025 per Market
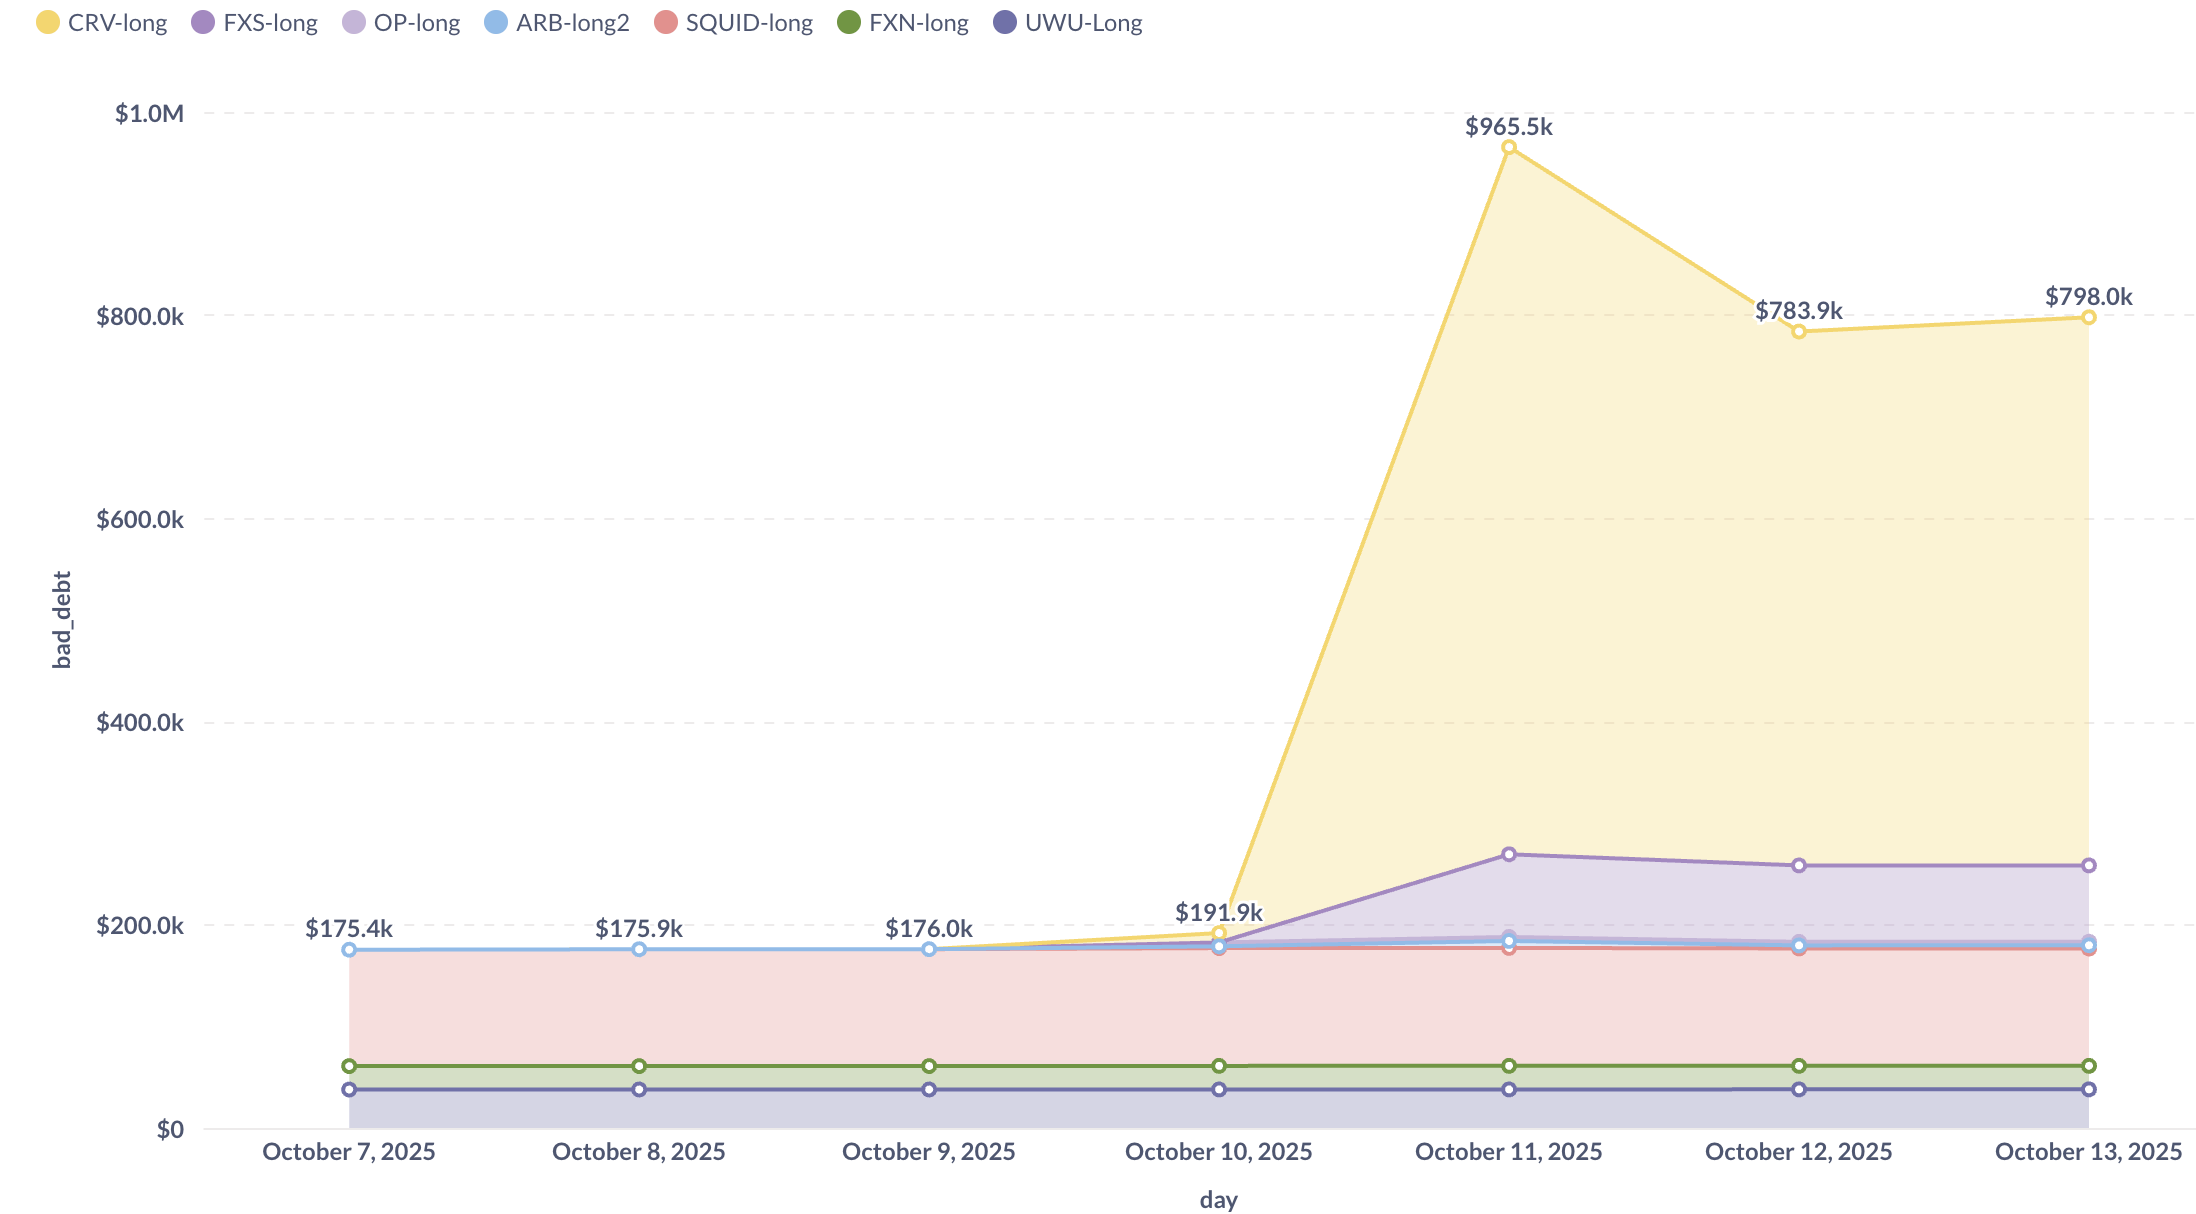
This chart shows us that Bad Debt from the following markets pre-dated the market crash on October 10th:
- UwU-long
- FXN-long
- SQUID-long
The bad debt attributed specifically to the crash is attributable to:
- CRV-long
- FXS-long
- OP-long
- ARB-long2
Given that OP-long and ARB-long incurred minor losses (3.5k and 3.2K, respectively), we will focus on an in-depth post-mortem for CRV-long and FXS-long.
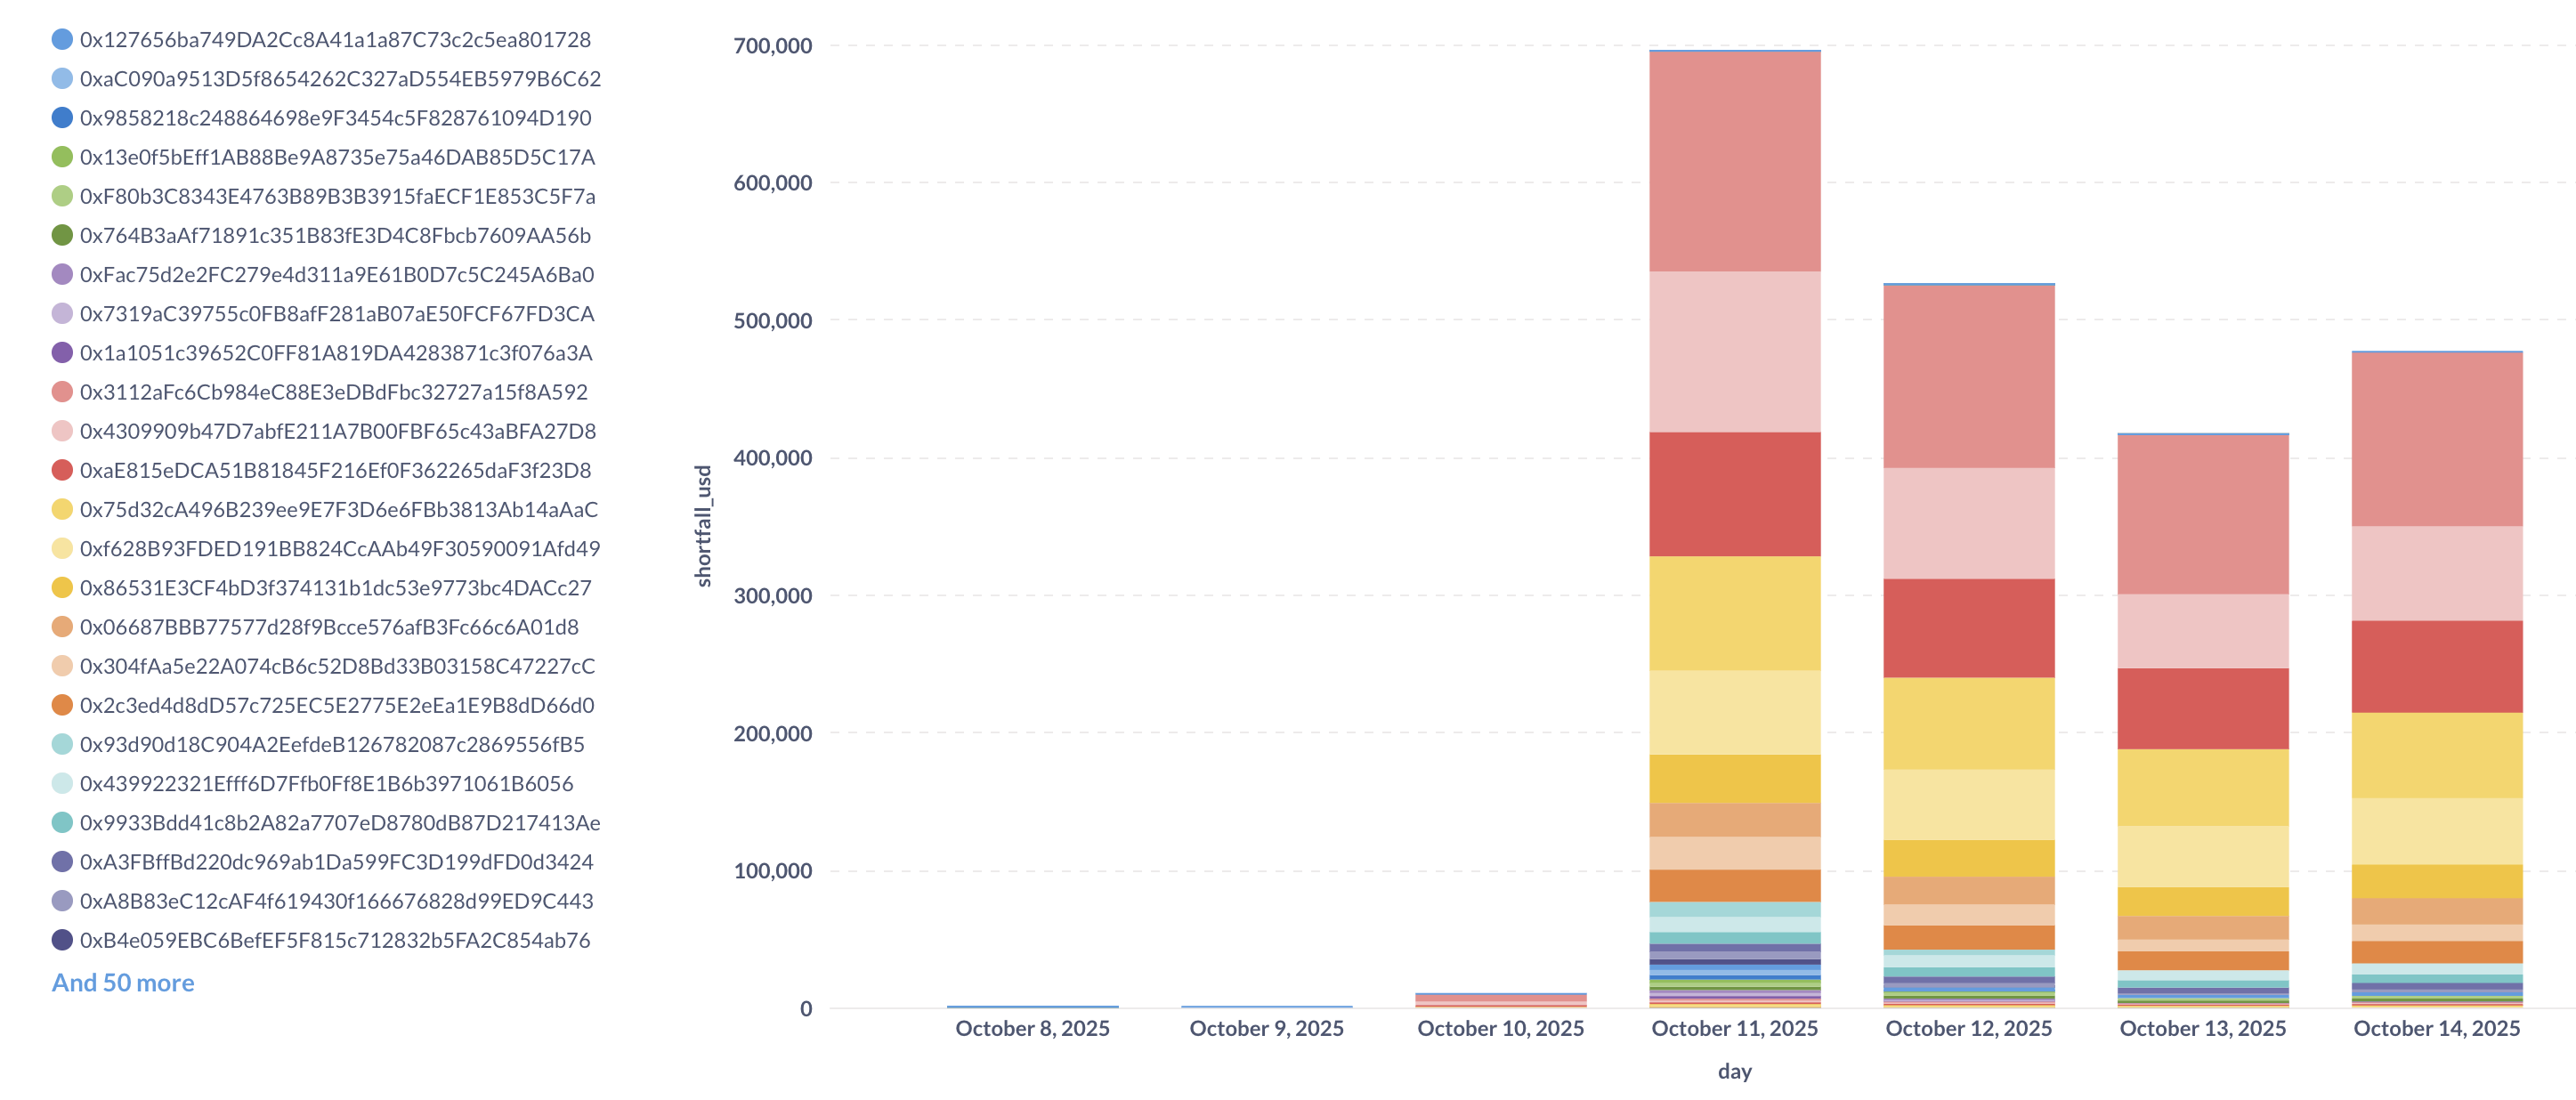
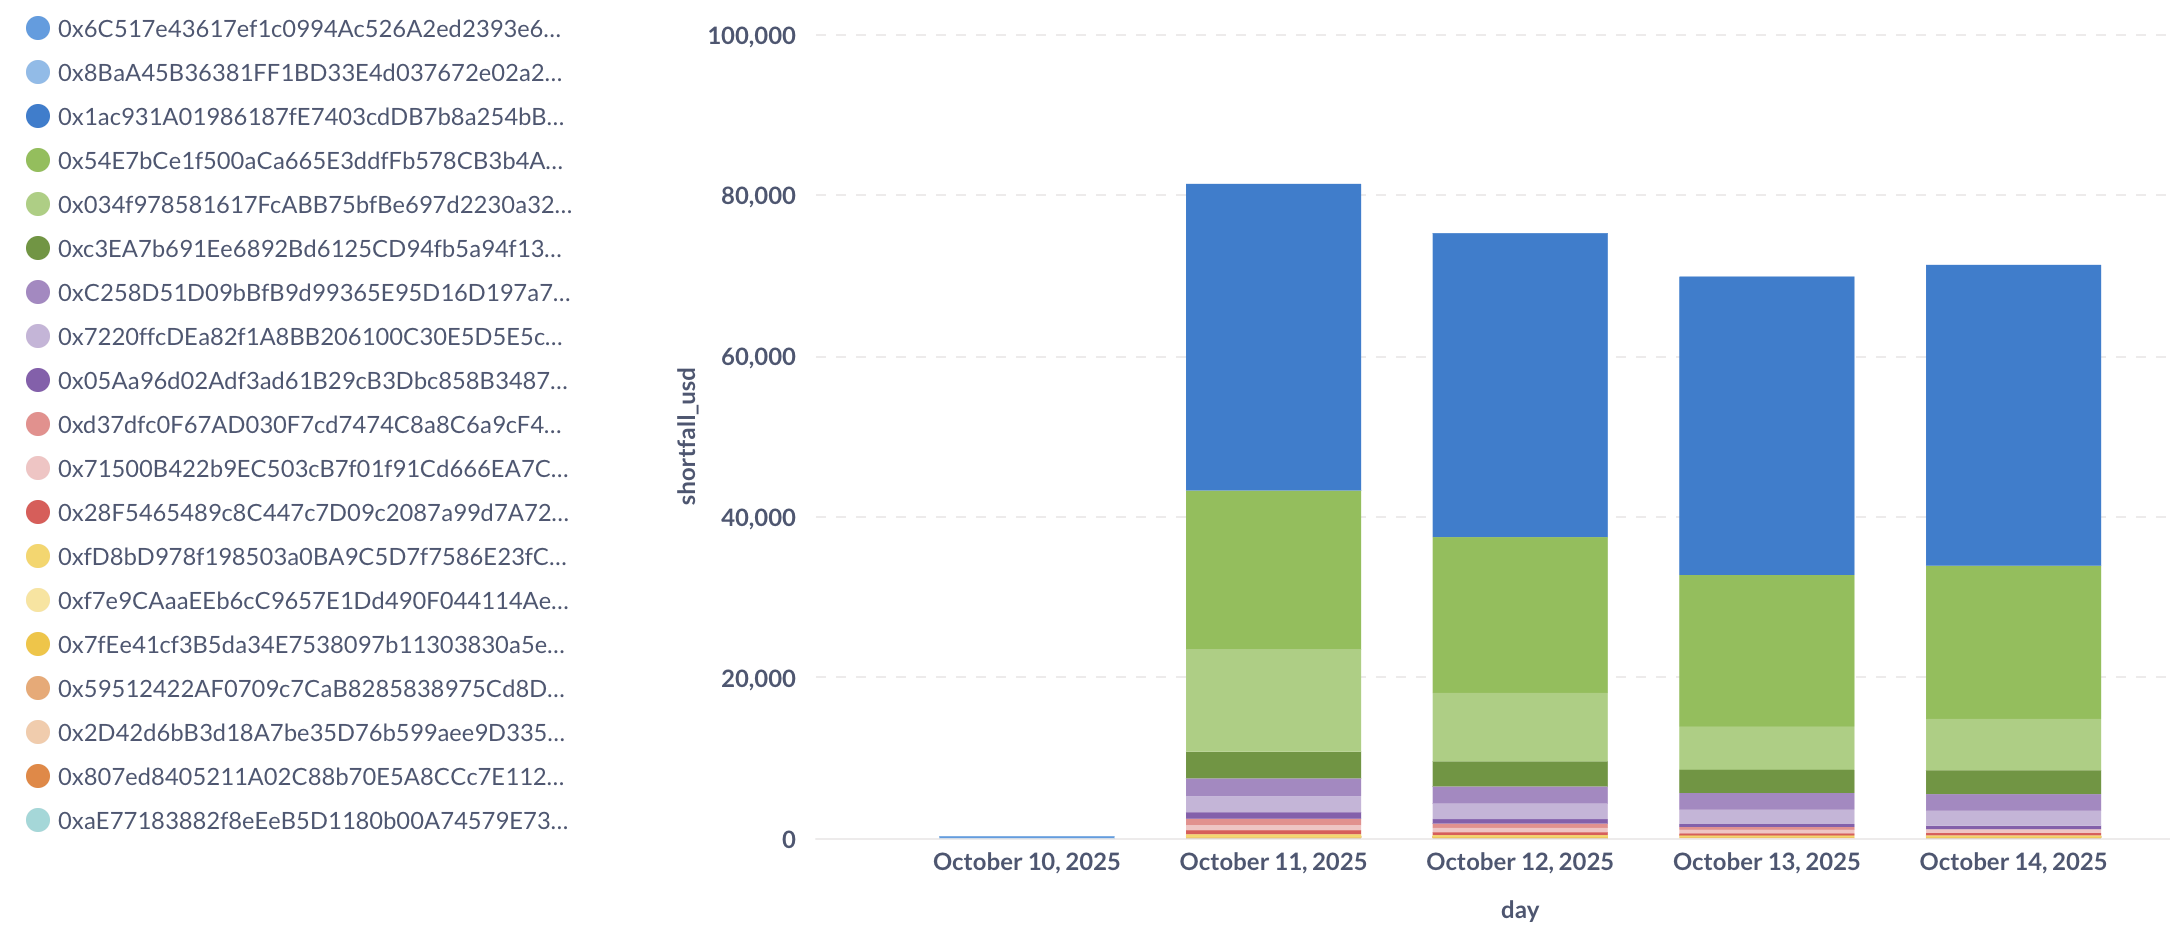
User distribution to Debt
CRV-long
FXS-long
Recovery prices
Refer to the analysis in this forum post. There is an overview of the state of bad debt in the CRV-long lend market and CRV recovery prices needed to achieve full solvency.
Re-parameterisation
We re-ran simulations for the CRV market since they were last run. Logs from the original simulation runs are here. Given below are the respective parameters used to run each simulation.
| Dimension | Original experiment | Our experiment |
|---|---|---|
| Data vintage | Jan 29, 2024 (dataset commit) | Oct 14, 2025 |
| Samples | 500,000 | 15,000 |
| Tail selection | n_top_samples = 50 → ES ≈ 99.99% (50 / 500k) |
n_top_samples = 150 → ES = 99% (0.01 × 15k) |
External fee (**ext_fee**) |
0.0005 | 0.0005 |
| Loan window (duration) | 0.5h | 24h |
| A sweep | 50 log-spaced points in [10, 300] | 25 log-spaced points in [10, 150] (plus local refinement when needed) |
Bands (**range_size**) |
4 | 4 |
AMM fee (**fee**) |
0.002 | 0.006 (contract value) |
EMA smoothing (**Texp**) |
600 s | 600 s |
| add_reverse | True (time-reversed copy appended) | False (forward-only; forensic realism) |
Notes on the differences:
- Tail definition: Original uses an ultra-thin tail (ES~99.99%); our run uses ES 99%. ES 99% is less extreme but much more statistically stable at laptop budgets.
- Window length: Original 0.5h will understate overnight risk; our 24h targets “can the system withstand a day’s move?”—appropriate for liquidation/loan policy.
- Fee: We use 0.006 per the contract; original docs used 0.002 in examples. This shifts curves; comparisons should account for fee differences.
- add_reverse: Turning it off avoids mirror-path smoothing and keeps the analysis faithful to the forward market path during the period of interest.
- Search range for A: We narrowed the top end (≤150) since modern runs show the knee well below 150; we added a refined linear grid (e.g., 60–110) to zoom into a promising region.
Diagnostics for A
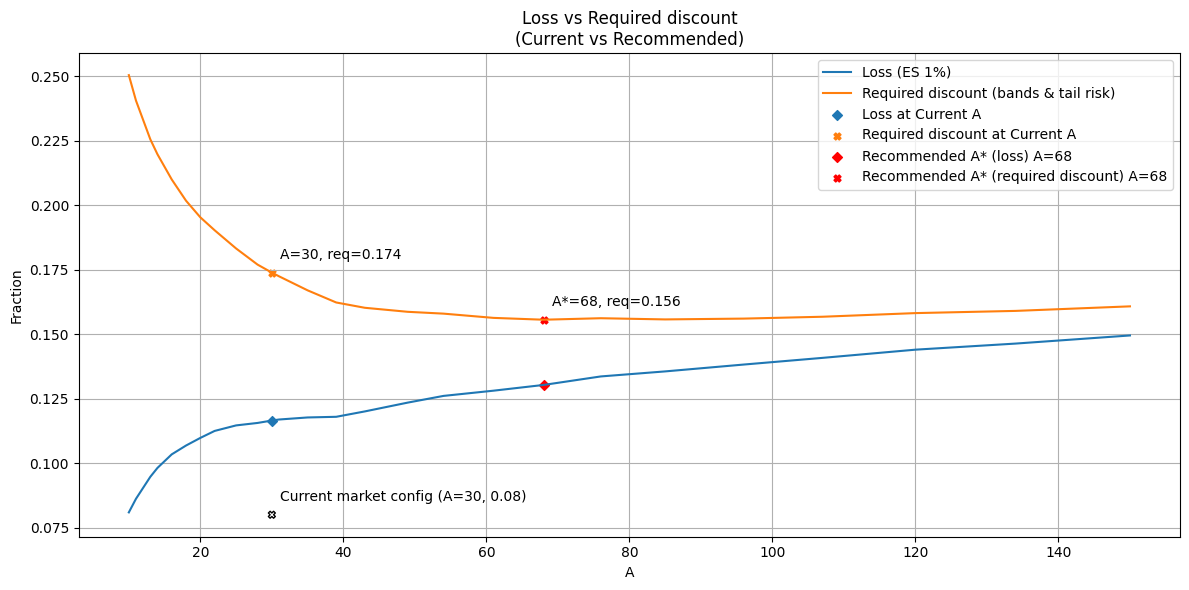
The region from A=60 to A=110 looks promising; hence, to give a more refined estimate of A, we ran a second iteration of experiments searching the space evenly in increments of 2 under the same settings.
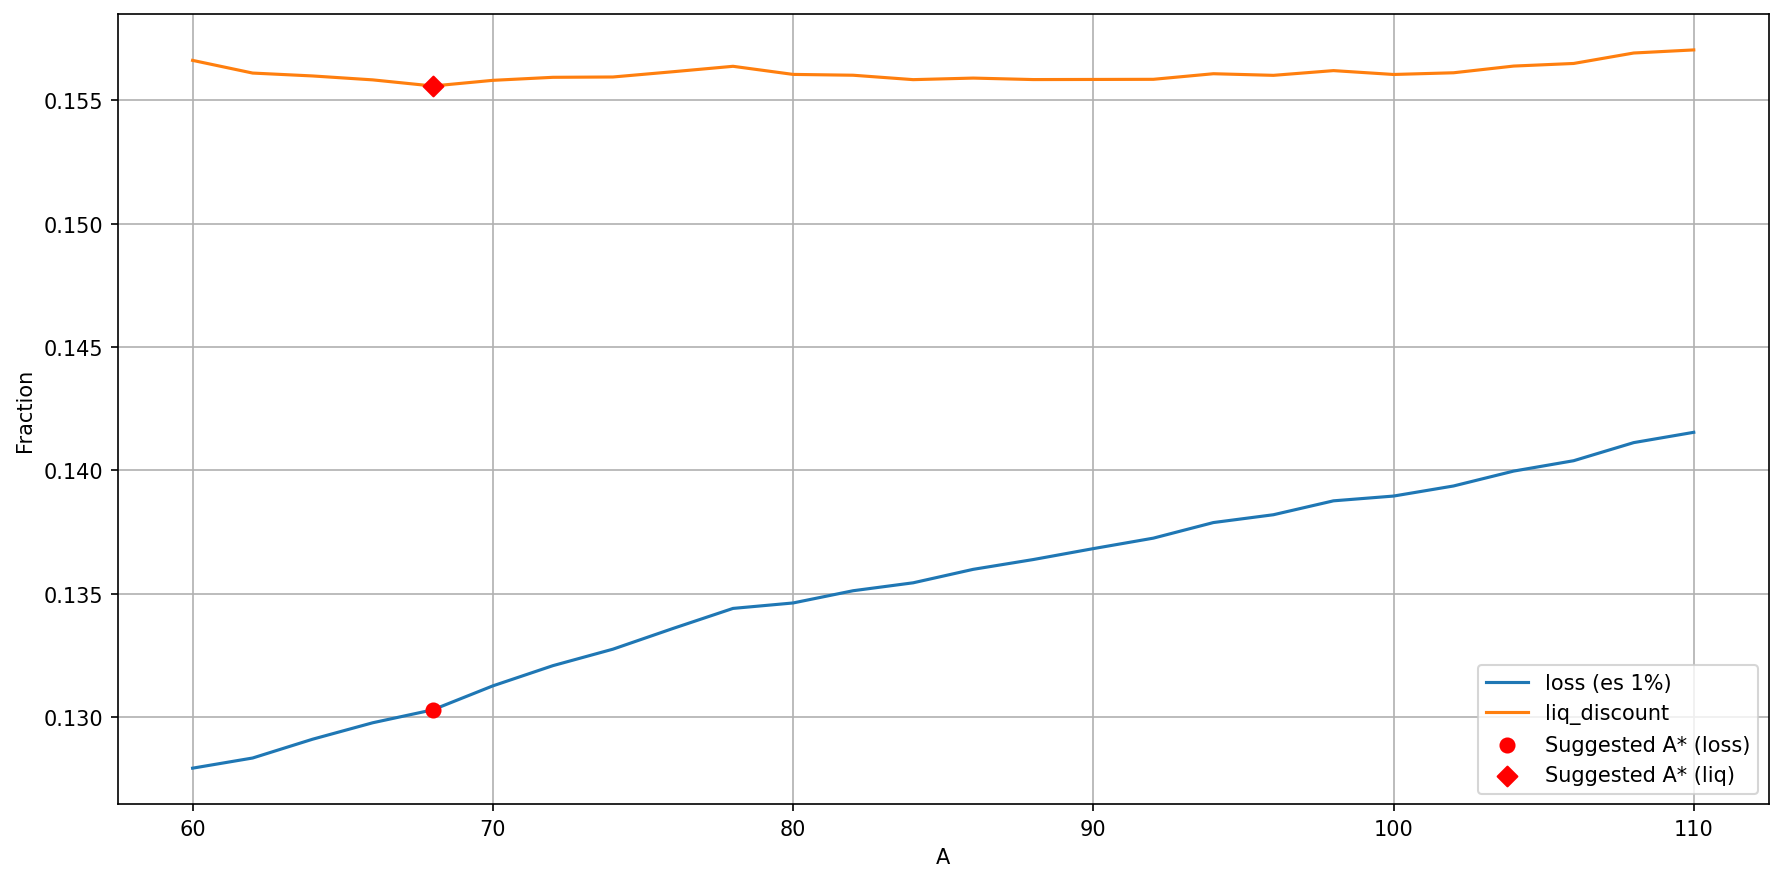
The zoomed sweep suggests A≈68 by the orange-min rule. Following the repo mapping, liquidation_discount would be the blue ES@1% at A=68, suggesting a value of 14% (~0.1303). Because we cannot change A in production (A=30 fixed), we instead propose liquidation_discount ≈ 12% (blue ES@1% at A=30).
Margin
To study the margin requirement, we look at how the margin requirement changes by narrowing in on the worst sampled period (i.e., the top 10% of worst scenarios, the top 5% of worst scenarios, and so on). We take the difference between the worst 1% and the worst 0.25% as the margin requirement. We choose 0.25% for extra conservatism (where Margin M = ES99.75−ES99)
For A=68 (given here as a reference):
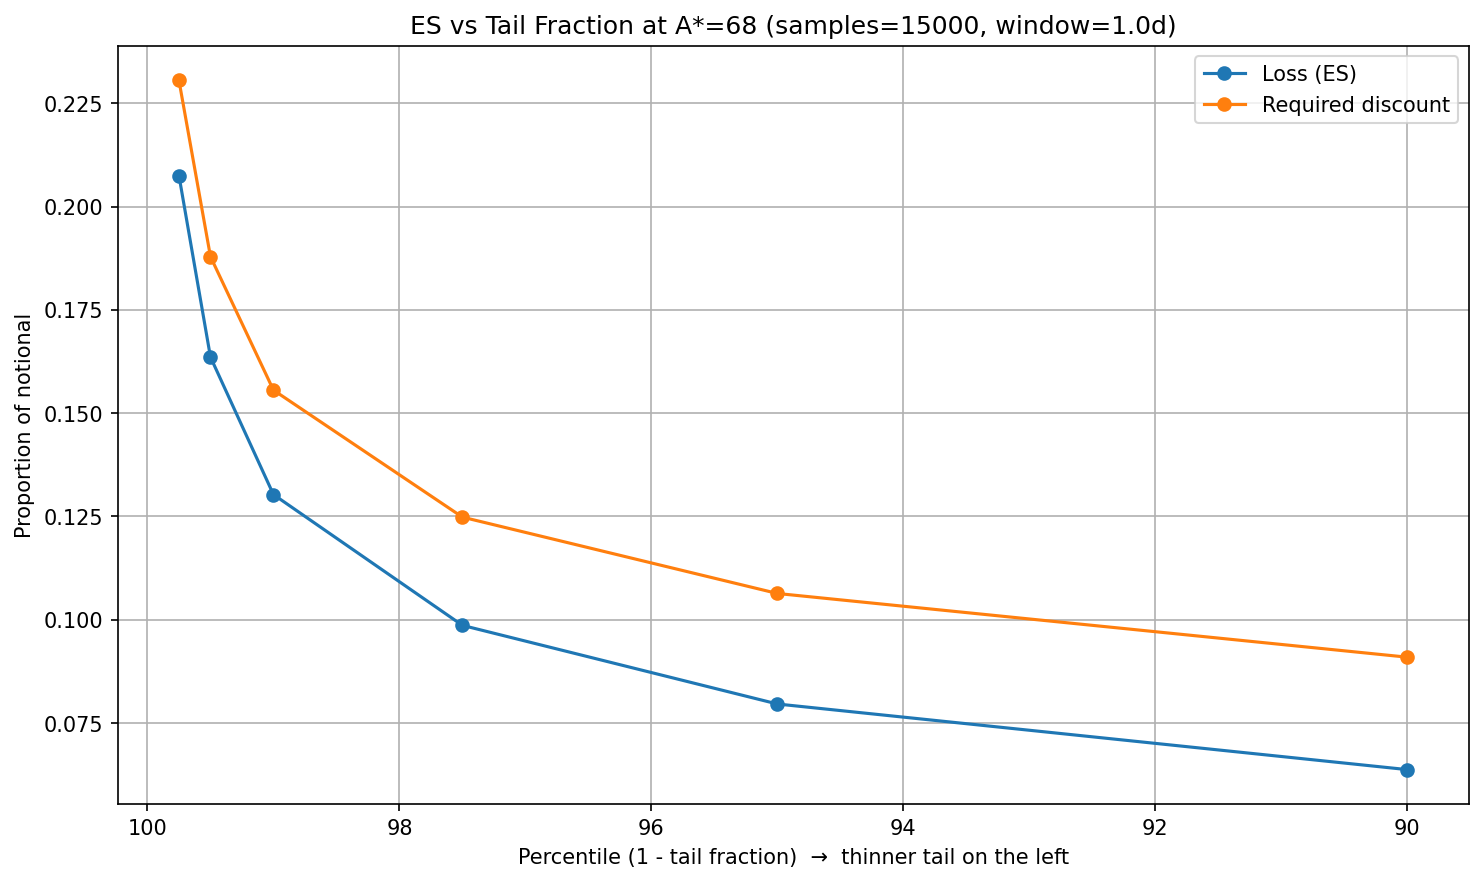
- Margin M: 7.72 pp
- Loan discount = 14.00% + 7.72% = 22% (21.72%)
For A=30:
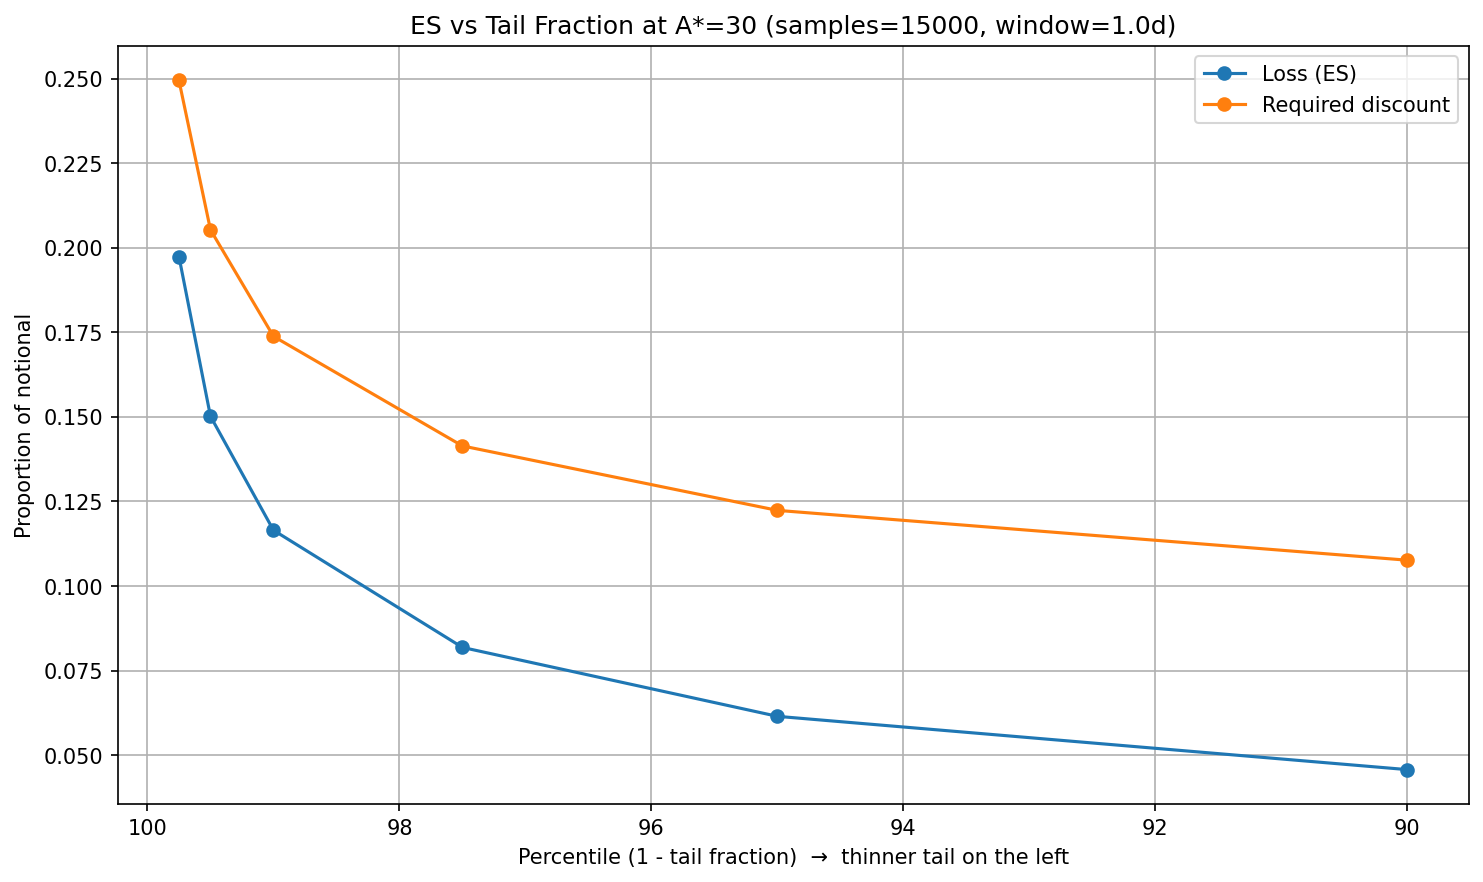
Zooming in on the blue line:
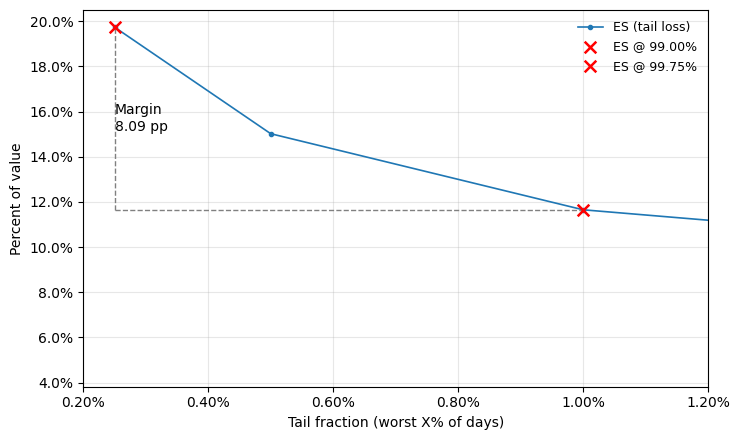
- Margin M: 8.09 pp
Loan discount = 11.7% + 8.09% = 20% (19.79)
What went wrong in the parameterisation of CRV-long?
Hypothesis - “Short window underestimates overnight risk.”
Using a short simulation window (e.g., 0.5h) to estimate tail loss (ES) systematically understates real overnight risk. This is because short windows capture fewer adverse swings. The measured tail loss is biased down, leading to an overly optimistic A, liquidation_discount, and loan_discount. In practical terms, what we are assuming if we simulate with a 30-minute window, is that the position is exposed for ~30 minutes before someone (user/bot/keeper/liquidator) can adjust, hedge, or liquidate.
To test this, we ran an experiment using changing duration in our sample and the effect on loss estimates.
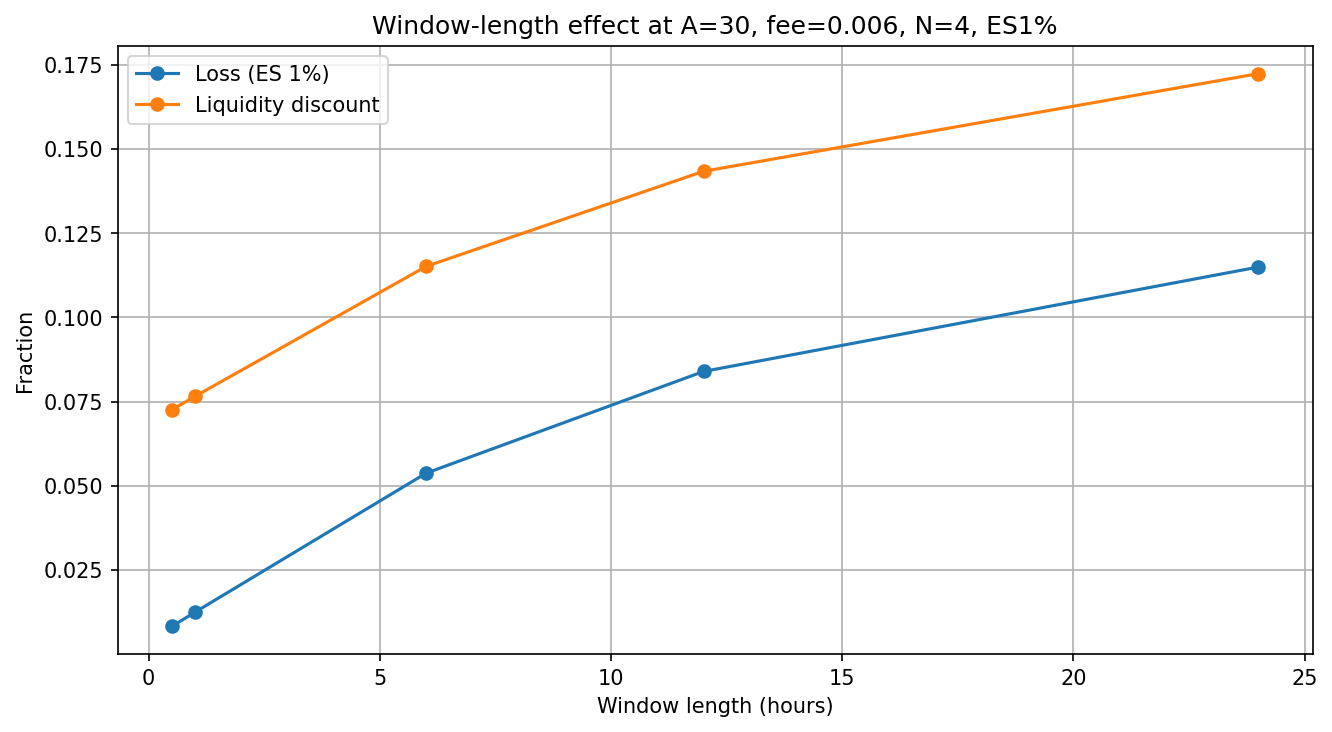
The hypothesis holds: loss_ES1 should increase as the window lengthens, indicating that short windows (e.g., 0.5h) underestimate overnight risk.
Action Plan
Immediate (7 days):
- Action: Increase Loan Discount to 20%.
- Impact: This will reduce the max LTV that new borrowers can take on (and existing borrow positions that are modified). It will not affect existing borrower positions, i.e., it will not negatively impact position health or induce liquidations. The new parameter is applied to a user’s existing position only when they interact with it.
This month (30 days):
- Action: We plan to increase the Liquidation Discount from 8% to 12%.
- Impact: This parameter will change the LTV where the position enters the liquidation zone. However, existing positions do not update its liquidation discount value until the user performs an interaction (such as repaying, borrowing more, or supplying collateral). crvUSD was designed specifically to prevent rug pulling borrowers due to a parameter change. Since there may be visibility issues on the UI and poor user understanding of this behavior, we will handle this adjustment more carefully. We will publicize our intention to update the liquidation discount in the near future.
Vote Actions
CRV_CONTROLLER = "0xEdA215b7666936DEd834f76f3fBC6F323295110A"
crv_controller = Contract(CRV_CONTROLLER)
liq_disc = crv_controller.liquidation_discount()

ACTIONS = [
    # Set CRV-long borrowing discounts
    (CRV_CONTROLLER, "set_borrowing_discounts", 200000000000000000, liq_disc),
]